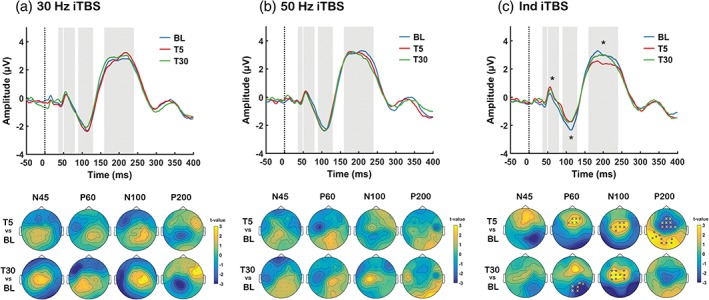
Figure 4.

Assessment of transcranial magnetic stimulation (TMS)‐evoked potentials (TEPs) following different intermittent theta burst stimulation (iTBS) conditions (a: 30 Hz iTBS, b: 50 Hz iTBS, c: Ind iTBS). Grand average TEP waveforms at baseline (BL: Blue), 5‐min post (T5: Red) and 30‐min post (T30: Green) using 3 fronto‐central electrodes (FC1, FCz and FC2). Topoplots represent t‐values for comparison between time points. Asterisks and “X”s on scalp maps indicate significant sensors between comparisons (cluster‐based statistics, *p < .01, X p < .025). For visualisation purposes, asterisks have been added to the TEP plots at deflections that were found to be significant in the cluster‐based statistics [Color figure can be viewed at http://wileyonlinelibrary.com]
