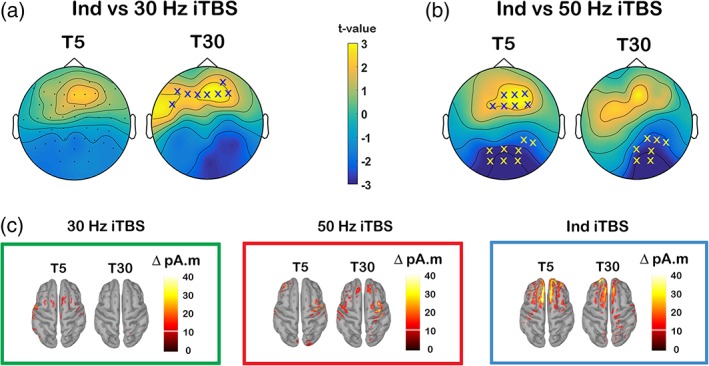
Figure 5.

Comparison of the change in transcranial magnetic stimulation (TMS)‐evoked P60 amplitude between different intermittent theta burst stimulation (iTBS) conditions. Scalp maps represent t‐values for comparison of Δ P60 between (a) Ind iTBS and 30 Hz iTBS and (b) Ind iTBS and 50 Hz iTBS. (c) Minimum norm estimates (MNEs) of the source level activity at the cortex for the Δ P60 peak in different stimulation conditions. “X”s on scalp maps indicate significant sensors between comparisons (cluster‐based statistics, X p < .025) [Color figure can be viewed at http://wileyonlinelibrary.com]
