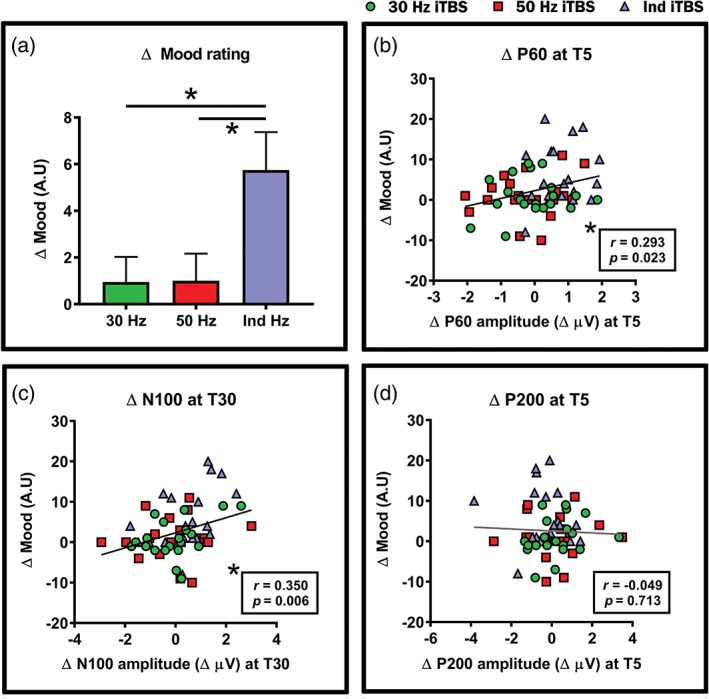
Figure 7.

Impact of different intermittent theta burst stimulation (iTBS) condition on mood. (a) Significant differences between Ind iTBS and 30/50 Hz iTBS in mood. Correlations between iTBS‐induced changes in mood (Δ mood) and the amplitude of transcranial magnetic stimulation (TMS)‐evoked (b) Δ P60, (c) Δ N100 and (d) Δ P200. Asterisks indicate significant differences/correlations (p < .05) and error bars in (a) indicate standard error of means (SEM) [Color figure can be viewed at http://wileyonlinelibrary.com]
