
Figure 5.
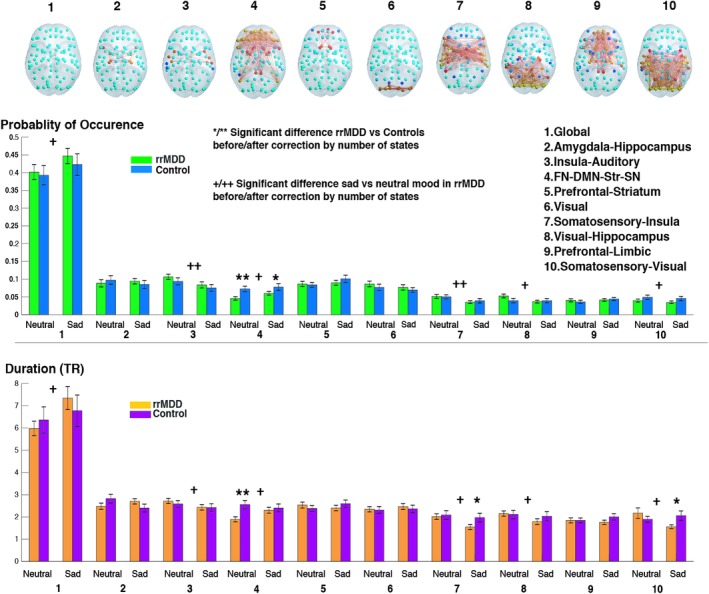
Differences in probability and duration of each functional connectivity (FC) state between and within groups for neutral and sad mood conditions for k = 10. FC states are represented in the cortical space, where functionally connected brain areas (represented as spheres) are colored alike. The spheres colored in yellow/red represent areas that are all positively correlated between them, but negatively correlated with the rest of the brain (cyan/blue colored spheres). Names of FC states were defined by loading network maps into neurosynth, http://neurosynth.org/decode/, a platform for large‐scale, automated synthesis of functional magnetic resonance imaging (fMRI) data. In the case of the state that was significantly different between groups, (FC state 4), we additionally compared the FC state with resting‐state networks (RSNs) defined by a whole‐brain parcellation scheme (Choi et al., 2012; Yeo et al., 2011) (Figure S5, Supporting Information). Of note, when considering other clustering solutions other FC states may be identified. */** Significant difference between rrMDD and controls before/after correcting for number of states (*p < 0.05, **p < 0.05/k), +/++ Significant within‐group difference for rrMDD, neutral versus sad before/after correcting for number of states (+p < 0.05, ++p < 0.05/k). Abbreviations: DMN = default mode network; FN = frontal network; MDD = major depressive disorder; rrMDD = remitted recurrent MDD; SN = salience network; Str = striatum; TR = repetition time [Color figure can be viewed at http://wileyonlinelibrary.com]