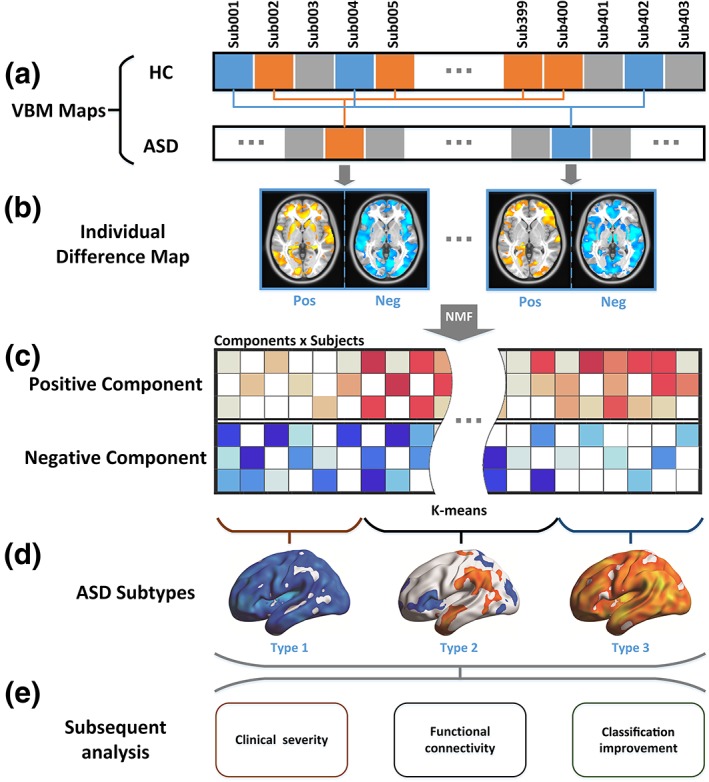
Figure 1.

Data analysis flowchart analysis flowchart. (a) For each subject, a VBM map was calculated. For each ASD subject, 20 HC subjects who were most matched with the corresponding ASD subject were selected (see Methods: Structural difference map). In panel a, HC subjects with the same color with ASD subjects were selected as the most matched HC subjects. (b) For each ASD subject, a structural difference map was calculated. Then the structural difference maps were divided into positive and negative (see Methods: Structural difference map). (c) A non‐negative matrix factorization (NMF) method was used to reduce the feature dimensions. Red cells represent the coefficients of positive components and blue cells represent the coefficients of negative components. (d) The coefficients corresponding to the NMF components of each subject were used as features in cluster analyses (see Methods: Cluster analysis). (e) Subsequent analyses compared the behavior and brain functional traits of ASD subtypes (see Methods: Clinical severity and neuroanatomical subtypes of ASD and methods: Functional connectivity and neuroanatomical subtypes of ASD), and explored the advantages of subtyping ASD to classify ASD and HC based on the neuroanatomical images (see Method: Classification between subtypes of ASD and HC) [Color figure can be viewed at http://wileyonlinelibrary.com]
