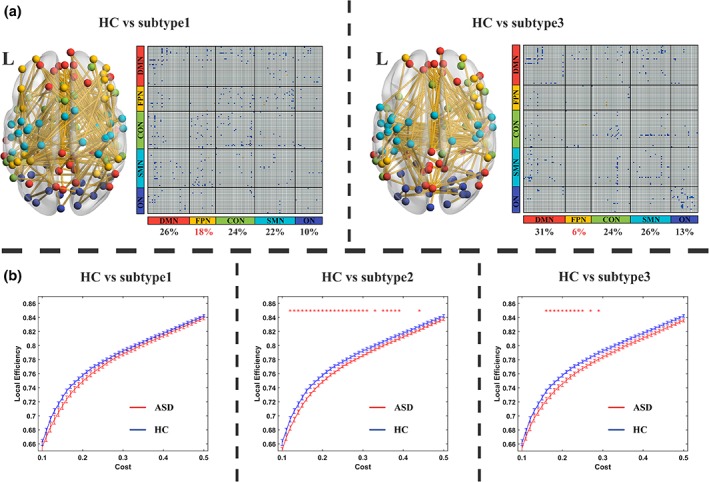
Figure 4.

Different atypical functional connectivity patterns across three ASD subtypes. (a) Different atypical functional connectivity patterns between HC and ASD subtypes. Blue cells in the functional connectivity matrix represent the connectivity of ASD subtype, which is lower than HCs. The nodes in the brain maps represent the ROIs located in different sub‐networks: Red nodes represent ROIs in default mode network; yellow nodes represent ROIs in fronto‐parietal network; green nodes represent ROIs in cingulo‐opercular network; blue nodes represent ROIs in sensori‐motor network and purple nodes represent ROIs in occipital network. We found no FC clusters showing significant differences between ASD subtype2 and HC. (b) Local efficiency among three ASD subtypes. Red stars represent significant differences found at corresponding cost. Error bars represent the standard error [Color figure can be viewed at http://wileyonlinelibrary.com]
