
Figure 3.
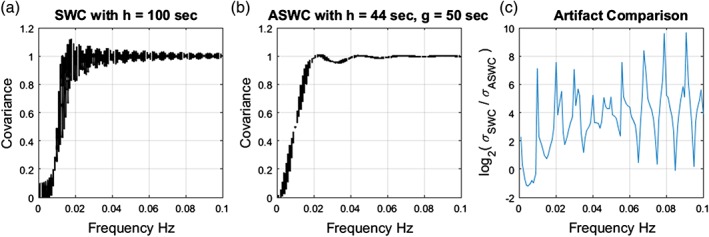
Comparing larger SWC length versus averaging using the same number of samples. The simulation in this plot was performed with a TR = 1 s and estimations were taken over 5 min. In the first panel (a), a window length of hSWC= 100 s was selected and the result was not averaged. A fifth‐order high pass Butterworth filter with cut‐off 0.01 Hz was applied to remove low frequencies of no interest. We can see the existence of spurious SWCs at frequencies not tuned to 1/100 Hz. In panel (b), time points were redistributed to have a window length of hASWC= 44 s and an averaging length of gASWC= 50 s. No filter was applied; the simulation used the natural filtering of ASWC described in Figure 2c, a tuned fit the 0.01 Hz cut‐off. (c) The ratio of standard deviations σSWC/σASWC has been plot in a logarithmic scale showing that SWC exhibit higher artifact power than ASWC at frequencies higher than the cut‐off 0.01 Hz [Color figure can be viewed at http://wileyonlinelibrary.com]