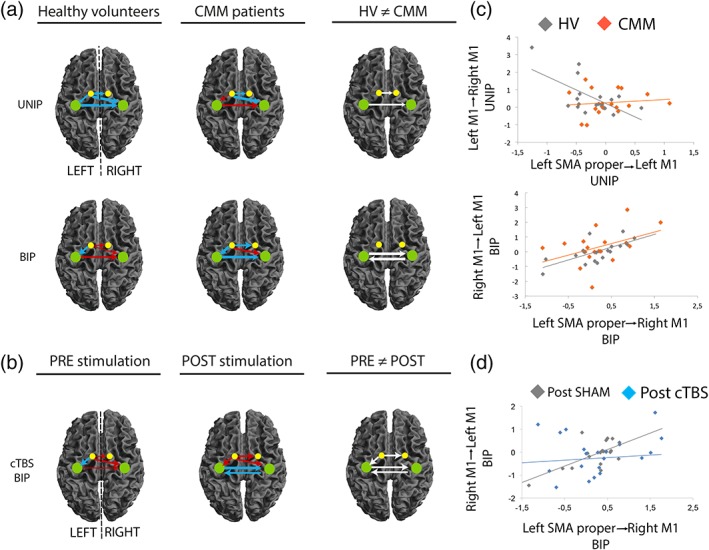
Figure 4.

Supplementary motor area (SMA) connectivity network during the delay period. (a) SMA network connectivity between unimanual preparation (UNIP) and bimanual preparation (BIP) in healthy volunteers (HVs) and in congenital mirror movement (CMM) patients. The right column shows the connections that are significantly different between HVs and CMM patients during UNIP and BIP. (b) SMA proper network modulatory connectivity in HVs during BIP (preparation of bimanual movement) was affected by transient SMA disruption but not by the SHAM stimulation. The right column shows the connections that are significantly different between pre and post continuous theta‐burst stimulation (cTBS) sessions for the BIP condition. (c) During UNIP (preparation of unimanual movement), connectivity between left SMA proper and left M1 correlated with the connectivity between left M1 and right M1 in healthy controls (gray plot), but not in patients (orange plot). During BIP, connectivity between left SMA proper and right M1 correlated with the connectivity between right M1 and left M1 in healthy controls (gray), and showed the same tendency in patients (orange, p = 0.08). (d) During BIP, connectivity between left SMA proper and right M1 correlated with the connectivity between right M1 and left M1 in healthy controls after SHAM but not cTBS stimulation. The colors of the arrows represent connections showing a significant positive (red) or negative (blue) drive in each group. Arrow thickness represents the connectivity strength (larger arrows represent greater connectivity toward negative or positive values). White arrows indicate connections that are significantly different between HVs and CMM patients (a) or in HVs before and after cTBS on the right SMA (b). The colored dots indicate the SMA proper (yellow) and M1 (green) [Color figure can be viewed at http://wileyonlinelibrary.com]
