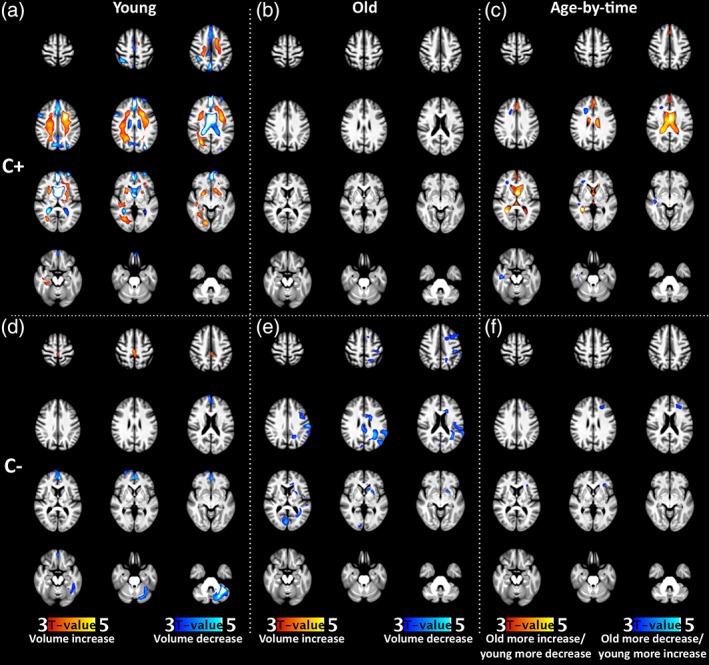
Figure 2.

Comparison of the volumetric changes in young and old women after cancer therapy. Changes are shown for C+ (Row 1, a–c) and C− (Row 2, d–f) patients. The first (a, d with n = 53,3) and second (b, e with n = 17,14) column show regions of significant volume increase and decrease over time for the different young (premenopausal) and old (postmenopausal) groups, respectively. The last column (c, f) show regions with a significant time‐by‐age interaction effect for each group. All statistical maps are thresholded at p < .05, FWE corrected at cluster level, and color‐coded according to t‐value. See Table A3 for statistical values and MNI‐coordinates of significant clusters. C+, patients with breast cancer who underwent chemotherapy; C−, patients with breast cancer who did not undergo chemotherapy [Color figure can be viewed at http://wileyonlinelibrary.com]
