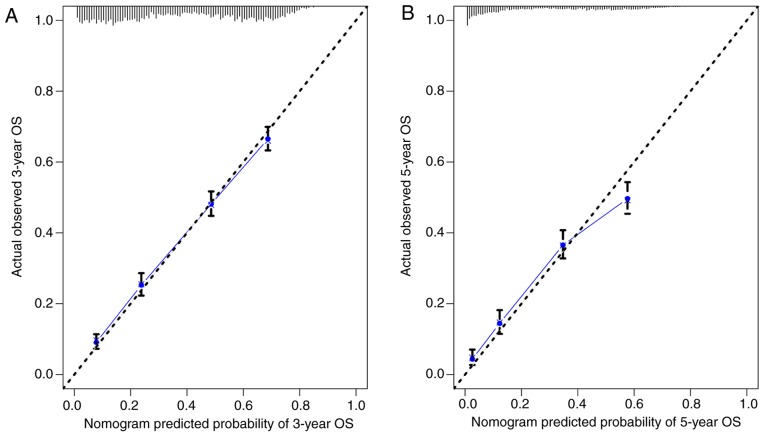
Figure 3.
(A) Calibration curve of the nomogram for predicting the 3-year OS rates of patients with stage II and III NSCLC from the validation set. (B) Calibration curve of the nomogram for predicting the 5-year OS rates of patients with stage II and III NSCLC from the validation set. OS, overall survival; NSCLC, non-small cell lung cancer.

