
Figure 1.
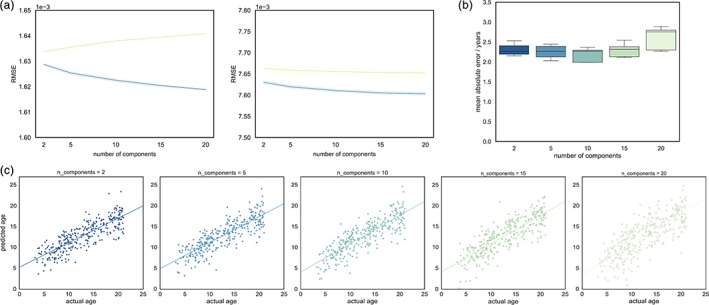
Reconstruction error and age prediction for increasing number of NMF components. (a) Reconstruction errors (RMSE; root mean squared error in terms of Euclidean‐normed cortical thickness or connectivity values), averaged over 5 Wold holdouts, for cortical thickness (left) and structural connectivity data (right). Error for training datapoints (blue) and held‐out test datapoints (green) are shown with 95% C.I. (b) Mean absolute error in age prediction is shown, averaged over 10 cross‐validation folds for each set of NMF components. (c) Individual age predictions are shown for each set of components [Color figure can be viewed at http://wileyonlinelibrary.com]