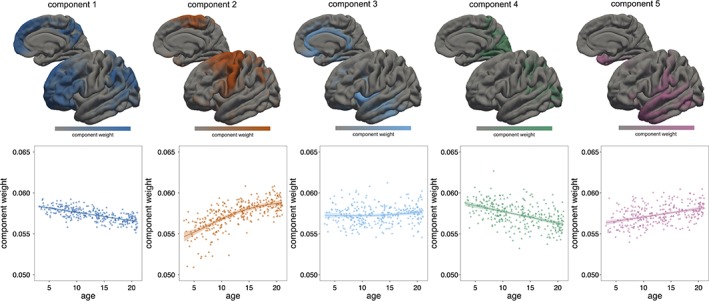
Figure 2.

Cortical NMF components. Spatial maps for the five‐component solution are shown with associated timecourses. Components weights are normalised to account for the mean trend in cortical thickness over time [Color figure can be viewed at http://wileyonlinelibrary.com]
