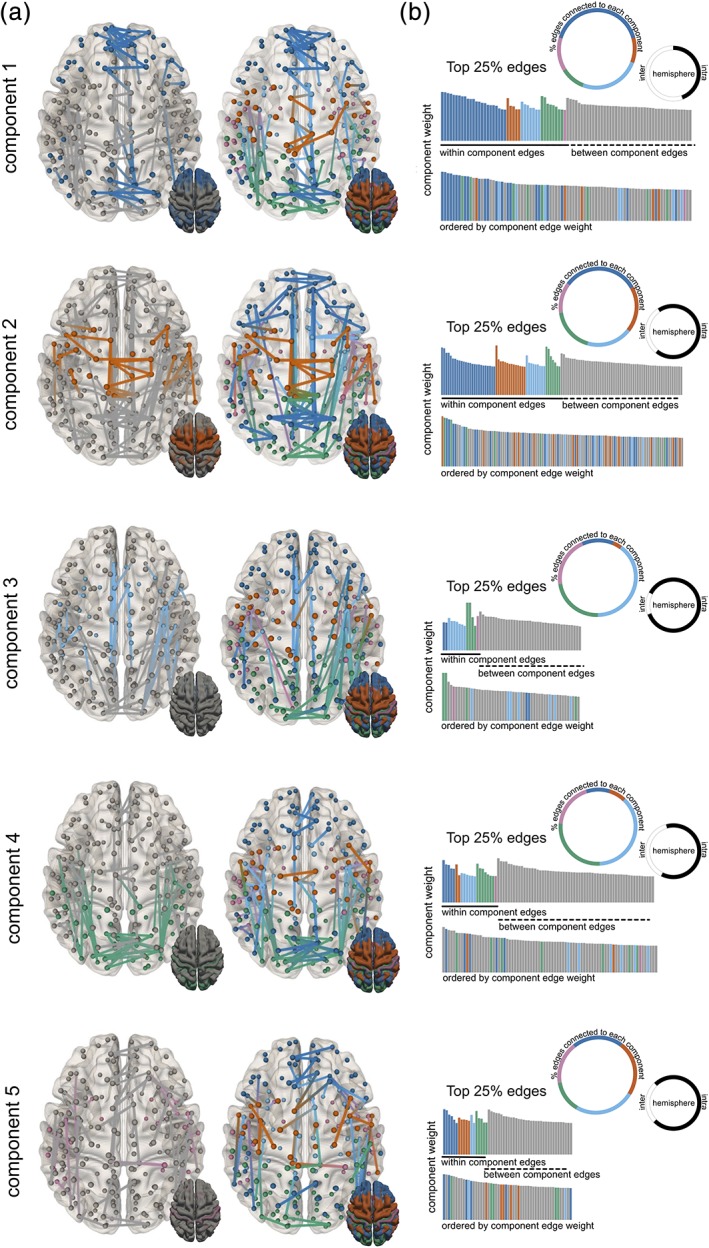
Figure 4.

Connectivity NMF components. (a) Connectivity subnetworks are shown in the same order as corresponding cortical components. The top 25% edges based on component weight are coloured based on connections to the corresponding component (left) or all components (right) with the colour along each edge representing the membership of nodes at each end (b) networks are summarised based on the proportion of edges connected different modules (coloured circle), the proportion of interhemispheric and intrahemispheric edges (black/white circle) and as a histogram of edge weights ordered by within‐ or between‐modules connectivity (top) and edge strength (bottom) [Color figure can be viewed at http://wileyonlinelibrary.com]
