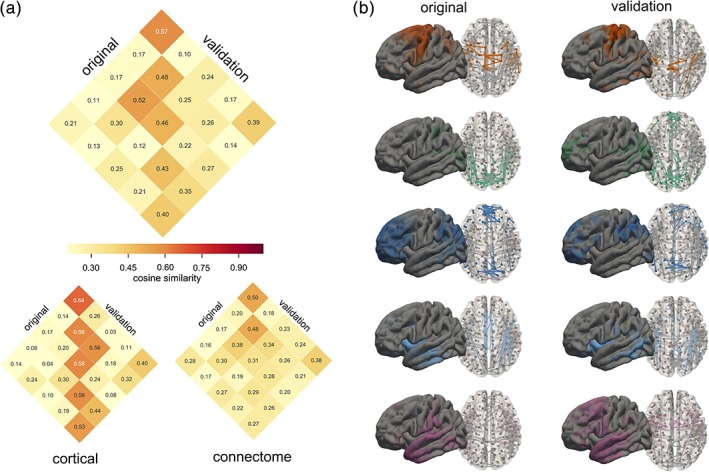
Figure 6.

Comparison of discovery and validation cohorts. (a) the average similarity between matched components in the original and validation cohorts are shown (top), within corresponding matrices for similarity of cortical maps and connectivity networks. (b) Comparison of cortical and connectivity components from the original and validation cohorts, ordered by average similarity [Color figure can be viewed at http://wileyonlinelibrary.com]
