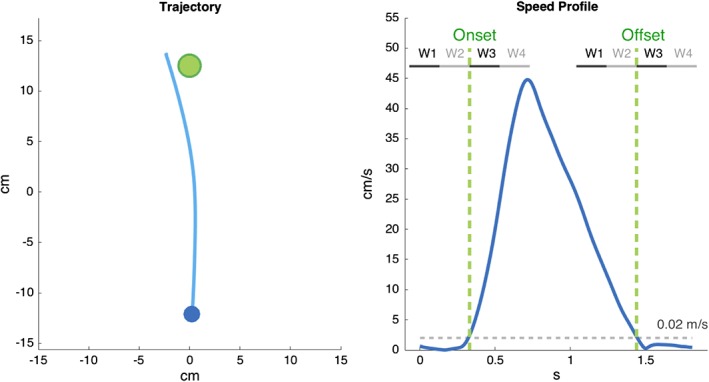
Figure 3.

Sample trajectory (left panel) and the corresponding bell‐shaped speed profile (right panel). Green dotted lines highlight movement onset and offset and the four time windows in which EEG signals have been averaged and analyzed [Color figure can be viewed at http://wileyonlinelibrary.com]
