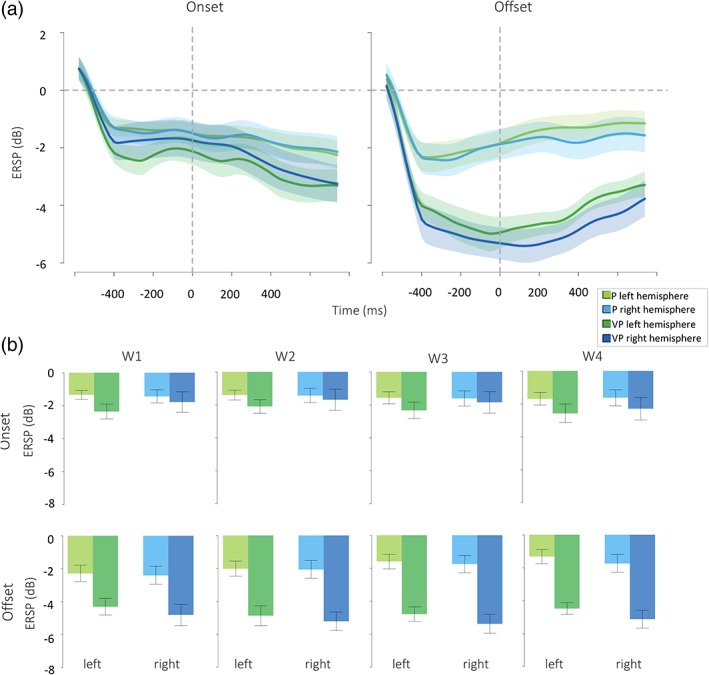
Figure 9.

(a) Event‐related spectral perturbation (ERSP) curves in the visual area during movement's onset (left panel) and offset (right panel). Green and blue lines represent the desynchronization in the left and right hemispheres, respectively. Dark green and dark blue indicate the visuo‐proprioceptive condition; the proprioceptive condition is represented in light green and light blue. (b) ERSP values in the four considered time windows for the left and right hemisphere in the two conditions [Color figure can be viewed at http://wileyonlinelibrary.com]
