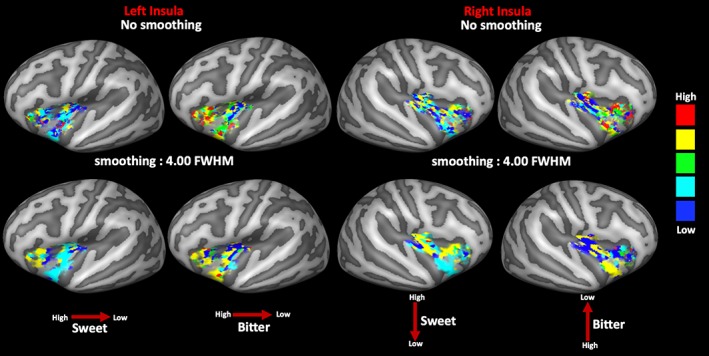
Figure 7.

Group‐based map of most responsive concentration computed in the regions of the significant main effects within the left (left side) and right (right side) insular cortices of sweet and bitter tastes (respectively, left and right columns) with and without spatial smoothing. Red arrows indicate the direction of the spatial gradient (high vs. low concentrations) [Color figure can be viewed at http://wileyonlinelibrary.com]
