Figure 1.

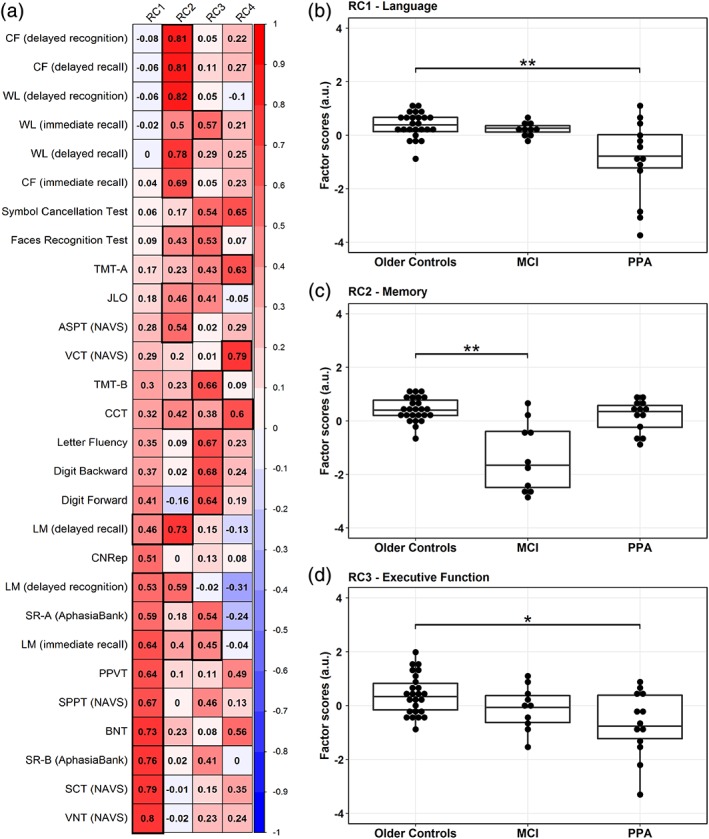
Results from the rotated principal component analysis (rPCA) on cognitive test scores. (a) Factor loadings representing the positive (in red) and the negative (in blue) correlations between cognitive test scores and four factors or rotated components (RC1‐4) derived from rPCA. Factor loadings with bootstrap ratios greater than 2.0 are highlighted by thick black lines. The first three RCs loaded highly onto test scores of language (RC1), memory (RC2) and executive function (RC3) abilities, respectively. RC1‐language (b) and RC3‐executive function (d) scores significantly differed between older controls and PPA but not MCI, whereas MCI differed from older controls on RC2‐memory (c) scores; horizontal lines within the boxplots in b–d represent the median, the bars represent the interquartile range, and the superimposed dots represent individual data points. a.u. = arbitrary units; *significance at p < .05; **significance at p < .001 [Color figure can be viewed at http://wileyonlinelibrary.com]
