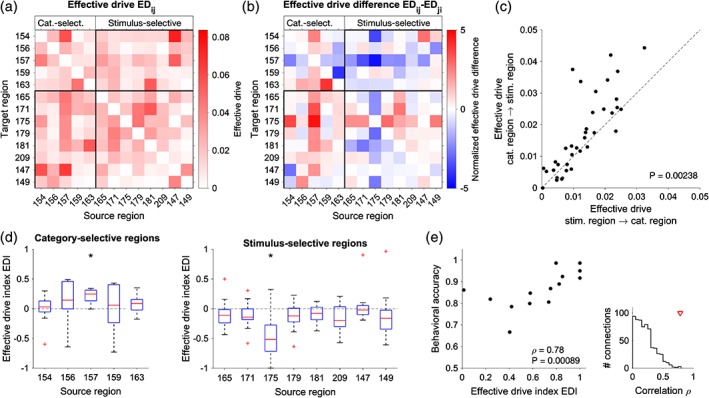
Figure 5.

Effective connectivity between category‐selective and stimulus‐selective regions. (a,b) Average effective drive (ED) (a) and corresponding ED difference (b) for selected regions (left cortex). Note that the ED difference between Regions i and j is the same as between Regions j and i, but with opposite sign, that is, if Region j drives Region i, then Region i is driven by Region j to the same degree. ED was estimated for each of the 14 subjects and then averaged across subjects. (c) Relationship of average ED between category‐selective and stimulus‐selective regions. The drive from category‐selective regions to stimulus‐selective regions is significantly larger than in the opposite direction (Wilcoxon test, p = 0.00238, N = 40, z = −3.03). (d) Effective drive index (EDI) defined as the sum of ED differences of a source region with all target regions normalized by the total ED between the regions (see Section 2). EDI tends to be positive for connections from category‐selective regions to stimulus‐selective regions (left) and negative for connections from stimulus‐selective regions to category‐selective regions (right). (*) indicates individually significant connections (Wilcoxon test, p < 0.05; Bonferroni corrected). (e) Relationship between the EDI of regions 157 (left precentral gyrus, category selective) and 175 (left inferior parietal, stimulus selective) and behavioral accuracy (Spearman correlation ρ = 0.785, p = 0.000892, N = 14 95% confidence interval for ρ = 0.445 to 0.959 obtained using bootstrap). The inset (right) shows the EDI–accuracy correlation between all cortical regions. The red triangle indicates the value observed for the EDI of Regions 157 and 175 [Color figure can be viewed at http://wileyonlinelibrary.com]
