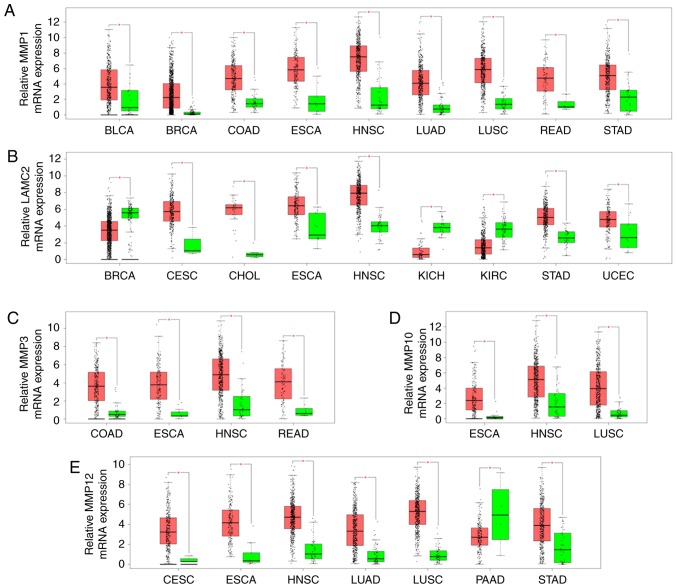
Figure 3.
Comparison of MMP1, LAMC2, MMP3, MMP10 and MMP12 expressions between cancer (Red) and normal tissues (Green) among 23 various types of cancer from The Cancer Genome Atlas according to GEPIA program. (A) MMP1; (B) LAMC2; (C) MMP3; (D) MMP10; (E) MMP12. The Y axis indicates the log2 (TPM + 1) for gene expression. The red and the green bars represent the cancer and normal tissues, respectively. These figures were derived from GEPIA. *P<0.01. BLCA, bladder urothelial carcinoma; BRCA, breast invasive carcinoma; CESC, cervical squamous cell carcinoma and endocervical adenocarcinoma; CHOL, cholangiocardinoma; COAD, colon adenocarcinoma; ESCA, esophageal carcinoma; GEPIA, Gene Expression Profiling Interactive Analysis; HNSC, head and neck squamous cell carcinoma; KICH, kidney chromophobe; KIRC, kidney renal clear cell carcinoma; LAMC2, laminin subunit gamma 2; LUAD, lung adenocarcinoma; LUSC, lung squamous cell carcinoma; MMP1, 3, 10 and 12, matrix metalloproteinase 1, 3, 10 and 12; PAAD, pancreatic adenocarcinoma; READ, rectum adenocarcinoma; STAD, stomach adenocarcinoma; UCEC, uterine corpus endometrioid carcinoma; TPM, transcripts per million.

