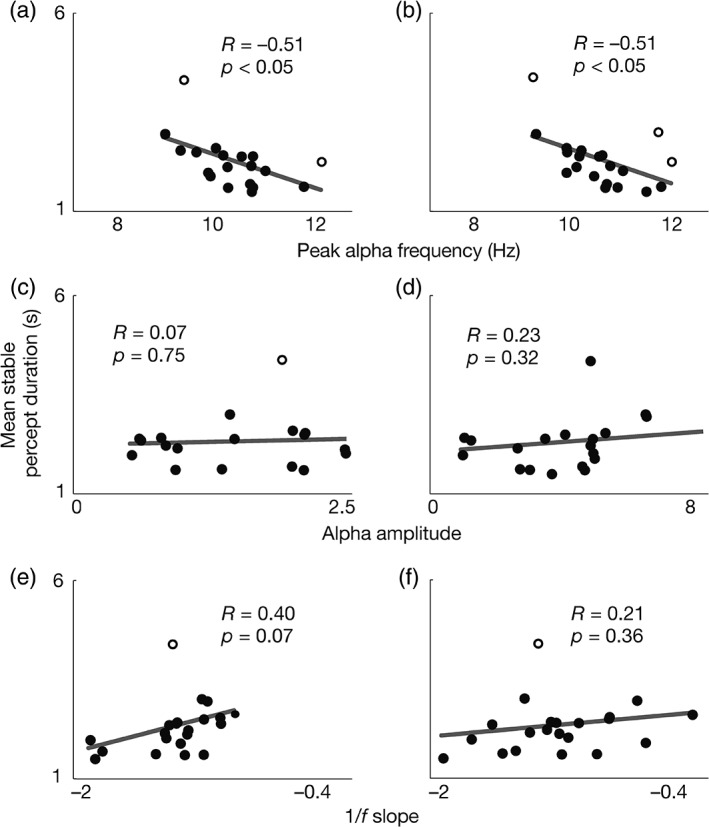
Figure 3.

Scatterplots for the exploratory sample of mean stable percept durations with (a,b) peak alpha frequency, (c,d) alpha amplitude, and (e,f) 1/f slope. (a,c,e) measured during fixation, and (b,d,f) measured during rest. Each dot represents one participant and unfilled circles indicate bivariate outliers. Lines show linear regression fits to all participants (including outliers)
