
Figure 3.
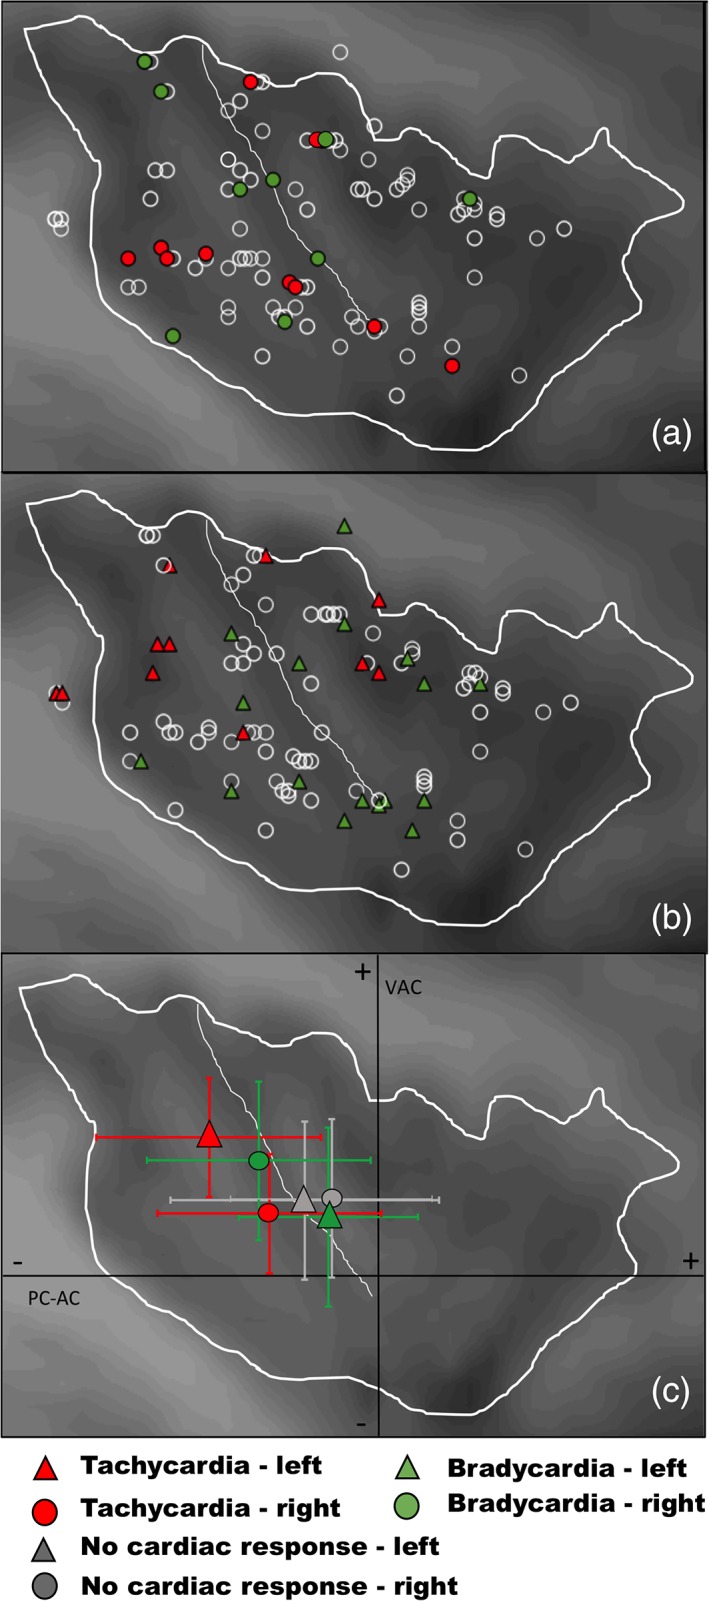
Spatial distribution of evoked cardiac responses according to the stimulation side, in right (a) and left insula (b). The barycenters and standard deviations of their Talairach coordinates (y and z axes) in right (c) and left. (d) Insula show that although left and right stimulations induced as much tachycardia as bradycardia, the implication of different insular subregions depended on the side stimulated: Tachycardia was preferentially evoked by stimulating insula in its right ventral posterior part, and in its left dorsal posteromedian part, whereas bradycardia was mainly induced by stimulations in the right dorsal insula and in the left ventral insula. PC‐AC: posterior commissure‐anterior commissure horizontal plane; VAC: vertical anterior commissure coronal plane [Color figure can be viewed at http://wileyonlinelibrary.com]