
Figure 3.
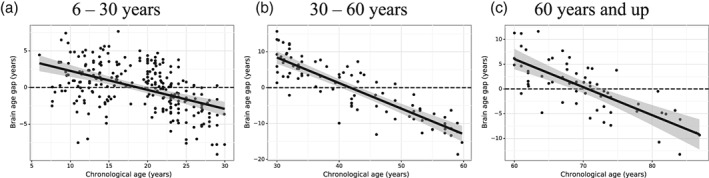
Brain age gap (the difference between predicted age and chronological age) as a function of the chronological age for different age ranges in 6–30 years (1,258 subjects, a), 30–60 years (457 subjects, b) and 60 years and up (311 subjects, c). The best fit of line of regression (black) is shown in each plot together with the 95% prediction interval (the shaded area)