
Figure 3.
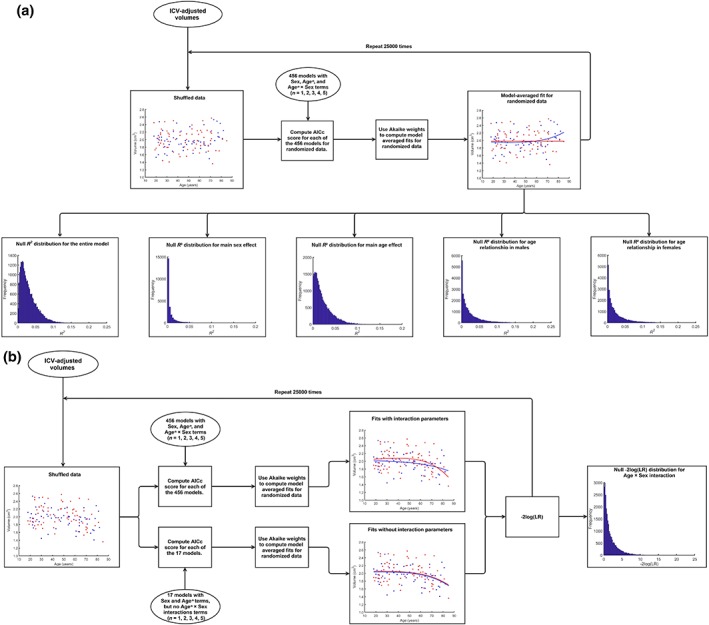
Flow chart depicting permutation methodology used to build null distributions to assess the statistical significance of the AG ROIs' (a) overall model significance, age, and sex effects, as well as (b) age by sex interactions. LR: likelihood ratio [Color figure can be viewed at http://wileyonlinelibrary.com]