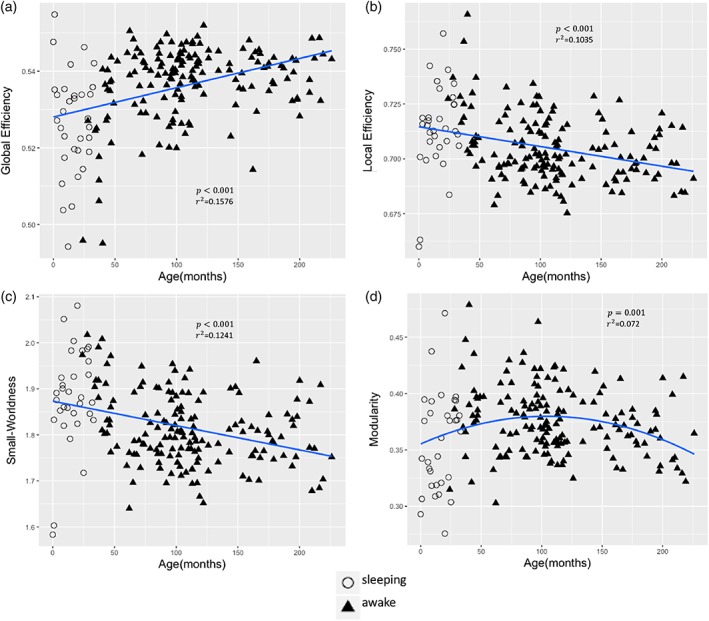
Figure 2.

Global network measures as a function of age. (a) Global efficiency. (b) Local efficiency. (c) Small‐Worldness. (d) Modularity. p < .05, FDR correction was applied to correct for multiple comparisons [Color figure can be viewed at http://wileyonlinelibrary.com]
