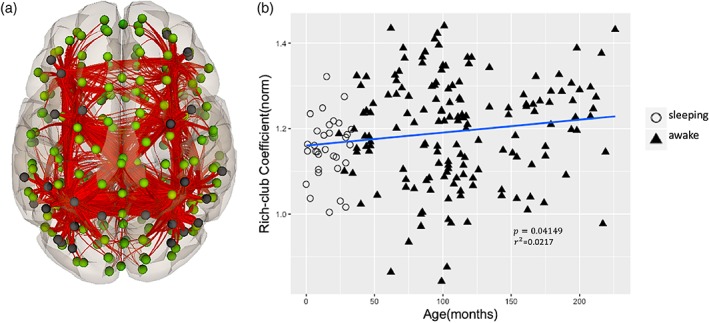
Figure 4.

Rich‐Club trends in the developing connectome. (a) Hub regions and connections. The black dots represent the hub regions. (b) Age‐related change in normalized Rich‐Club coefficient. p < .05, FDR correction was applied for multiple comparisons [Color figure can be viewed at http://wileyonlinelibrary.com]
