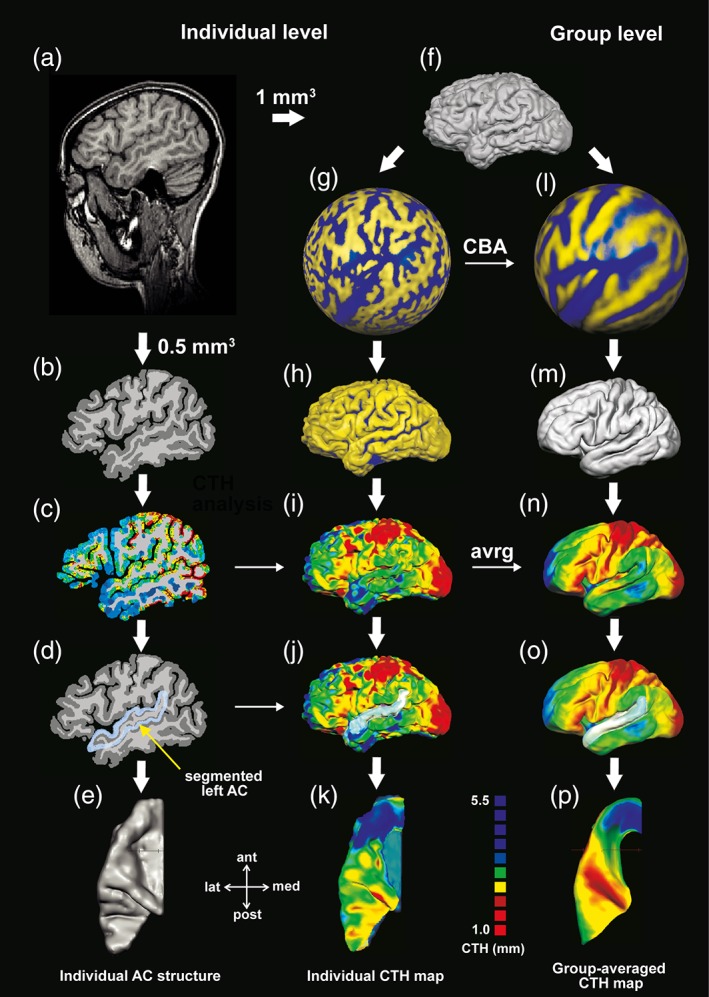
Figure 1.

Successive procedure for measuring individual and group‐averaged CTH. (a–e) Whole‐brain preprocessing, extraction of AC, and calculation of individual CTH maps for each hemisphere separately. (f–k) 3D reconstruction of individual whole‐brain surfaces including CTH mapping and extraction of AC for each individual and hemisphere. (l–p) co‐registration of individual hemispheres (during CBA process) followed by group‐averaged 3D reconstruction of the whole‐brain surface, CTH mapping, and extraction of AC
