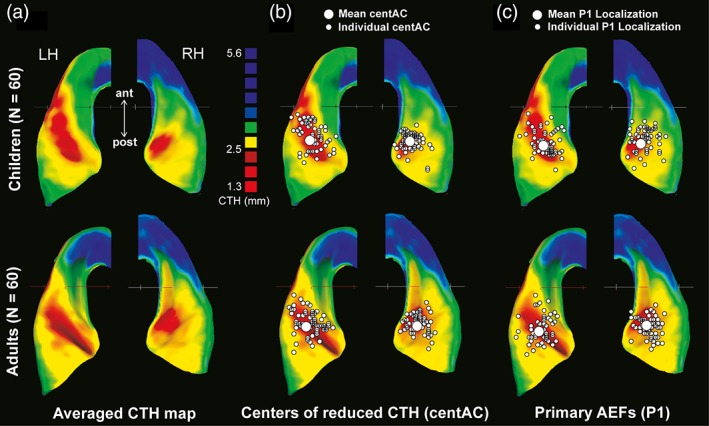
Figure 4.

(a) Average maps of the CTH distribution were mapped separately for both groups (60 children, 60 adults) and projected onto the corresponding structural averaged ACs respectively. The grouped CTH maps were thresholded to distinguish the areas of reduced CTH (centAC, CTH < 2.6 mm, indicated in red) from thicker surrounding areas (indicated successively in yellow, green and blue). The left hemisphere exhibits a more even distribution of CTH along the entire extent of HG, whereas the right hemisphere reveals a markedly thinner medial portion of HG as compared to its lateral portion. (b) Localizations of the individual centers of reduced AC (small white circles) in relation to the CTH maps and group‐averaged localization (large white circles). (c) Localizations of the individual primary auditory evoked P1 responses (small white circles) in relation to the corresponding CTH maps and group‐averaged localization (large white circle)
