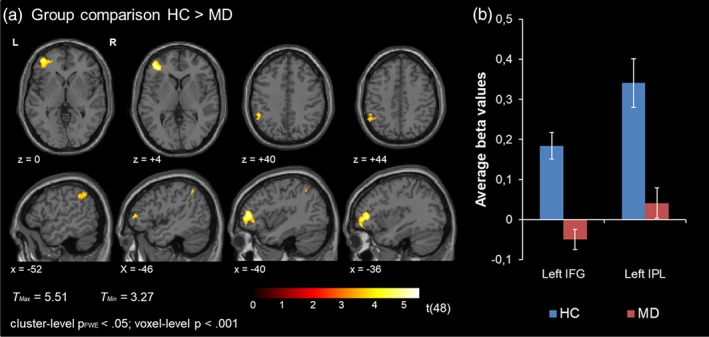
Figure 3.

(a) Group comparison. Significant group differences emerged in the left IFG and the left IPL. HC showed higher BOLD activation relative to patients with MD. (b) Extracted mean beta values from the left IFG and left IPL in patients and HC [Color figure can be viewed at http://wileyonlinelibrary.com]
