
Figure 4.
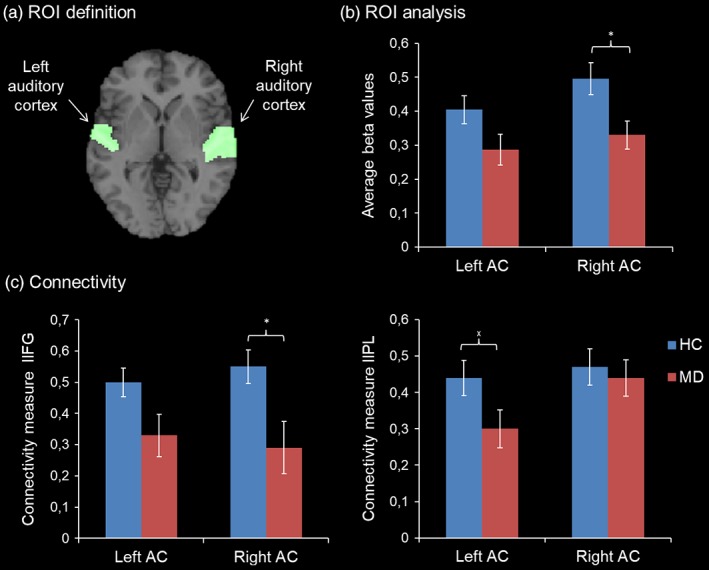
ROI analysis. (a) The ROIs were selected based on the AAL atlas and comprised bilateral STG and Heschl's gyri. (b) HC showed a higher BOLD response compared to patients with MD in the right auditory cortex only (*p < .05). (c) Connectivity analysis revealed reduced coupling between the left IFG and right auditory cortex in patients (left panel; *p < .05) and nominal significant group differences in connectivity between the left IPL and the left auditory cortex (right panel: x p < .05). Standard errors are indicated by the white error bars [Color figure can be viewed at http://wileyonlinelibrary.com]