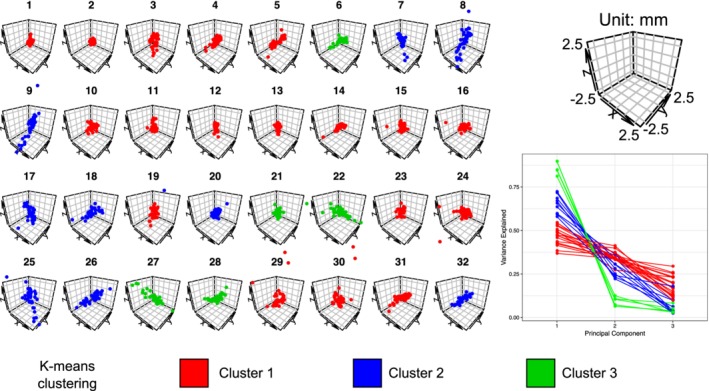
Figure 4.

K‐means clustering of point clouds relative to the mean fiducial location for each of the 32 AFIDs (left). Principle components analysis (bottom right) revealed three different general patterns were identified ranging from highly isotropic (Cluster 1: red) to moderately anisotropic (Cluster 2: blue) to anisotropic (Cluster 3: green). Results are shown for the MNI2009bAsym template. See the Supporting Information for similar plots for Agile12v2016, Colin27, and the templates combined [Color figure can be viewed at http://wileyonlinelibrary.com]
