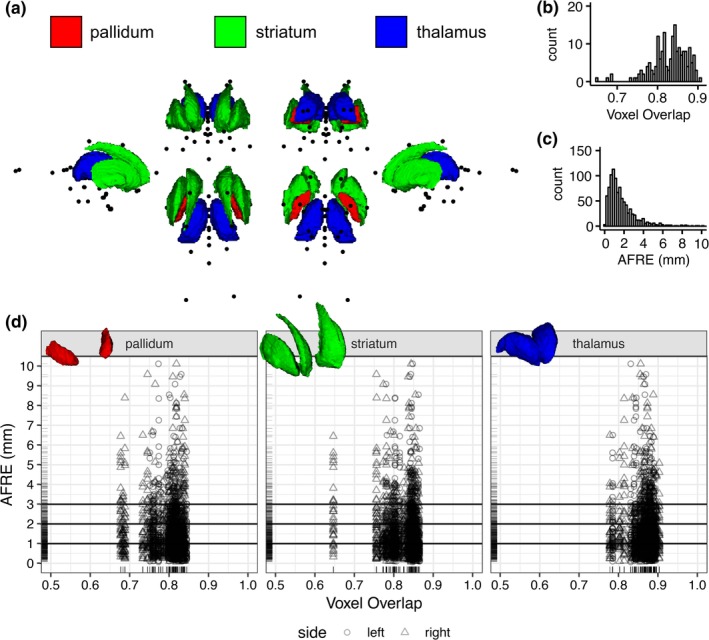
Figure 5.

A comparison of voxel overlap and distance metrics for establishing spatial correspondence between brain regions as evaluated on fMRIPrep output. (a) Multiple views showing the location of AFIDs (black dots) relative to three commonly used ROIs used in voxel overlap measures (the pallidum, striatum, and thalamus). (b,c) The histograms for voxel overlap (Jaccard index) and AFRE, respectively. The distribution for AFRE is more unimodal with a more interpretable dynamic range (in mm) compared to voxel overlap. Trellis plots demonstrate evidence of focal misregistrations identified by AFRE not apparent when looking at ROI‐based voxel overlap alone (d) [Color figure can be viewed at http://wileyonlinelibrary.com]
