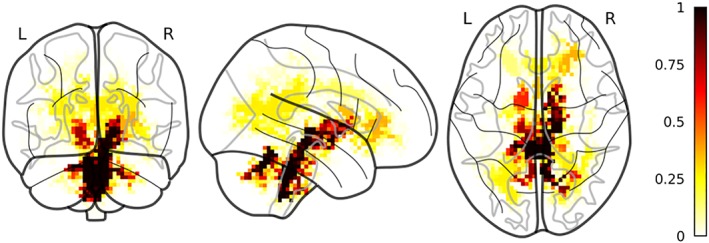
Figure 3.

Selected FA clusters. Discriminant FA clusters between NF1 and TD color coded according to the proportion of folds where a certain cluster was selected by the pipeline. Clusters are superimposed to a glass brain in MNI space [Color figure can be viewed at http://wileyonlinelibrary.com]
