
Figure 3.
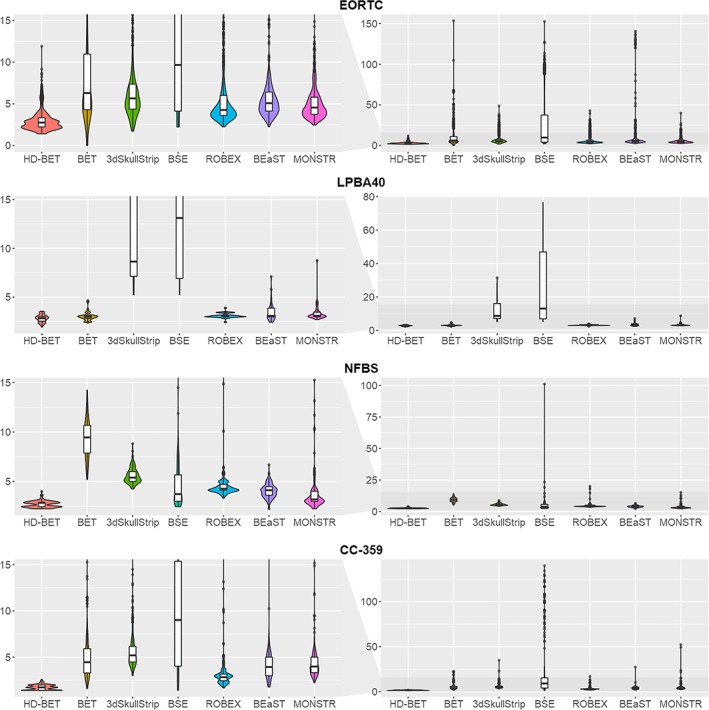
Comparison of Hausdorff distance (95th percentile) between the HD‐BET algorithm and the six public brain extraction methods for each of the test datasets using violin charts (and superimposed box plots; lower values indicate better performance). The median Hausdorff distance was lowest for the HD‐BET algorithm across all datasets (see left column visualizing the relevant range of Hausdorff distance ≤15 mm). Note the spread of the Hausdorff distance, which is consistently lower for the HD‐BET algorithm (right column visualizing the whole range of values) [Color figure can be viewed at http://wileyonlinelibrary.com]