
Figure 2.
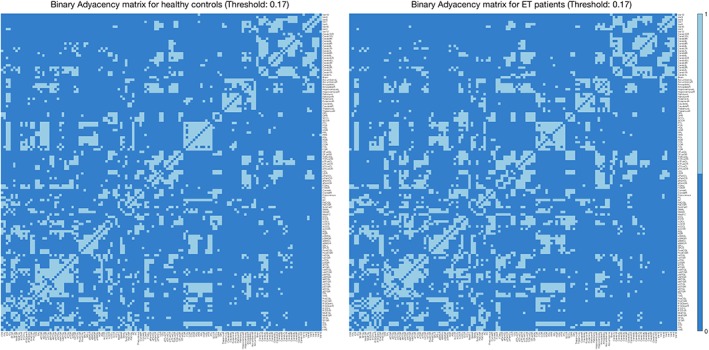
Mean binary adjacency matrixes in healthy controls and essential tremor (ET) patients at a correlation threshold of 0.17. The mean values are those present in at least half of the subjects [Color figure can be viewed at http://wileyonlinelibrary.com]