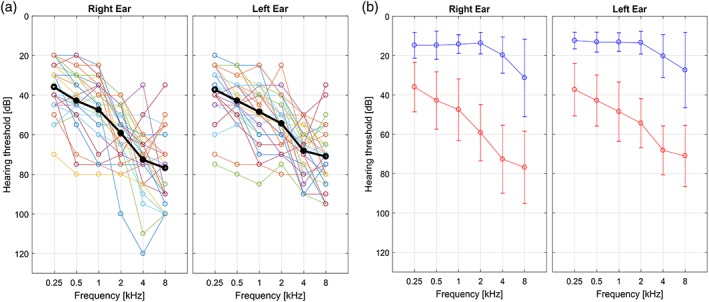
Figure 1.

(a) Hearing loss (HL) characterization of each patient in right and left ear respectively. (b) Mean and SD across HL (red) and normal hearing (NH; blue) subjects of the hearing thresholds for both ears. The thresholds were assessed at six different frequencies with pure tone audiometry [Color figure can be viewed at http://wileyonlinelibrary.com]
