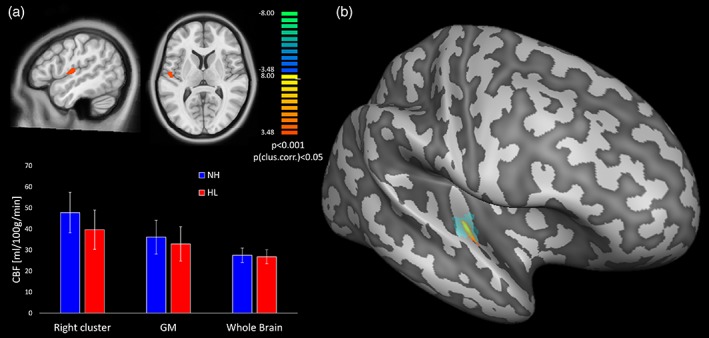
Figure 3.

(a) Statistical t maps of the voxel‐based comparison between hearing loss (HL) and normal hearing (NH; p < 0.05, cluster‐level corrected for multiple comparison in the bilateral primary auditory cortex as search volume) and bar plots of the mean cerebral blood flow (CBF; PV uncorrected) with SD bars for the two groups in: (i) the significant cluster in the right primary auditory cortex, (ii) the whole GM, and (iii) the whole brain (i.e. WM + GM + CSF). (b) Projection of the significant cluster, and of the anatomical location of the lateral Heschl's gyrus, on the reconstructed surface mesh of right hemisphere of the MNI template [Color figure can be viewed at http://wileyonlinelibrary.com]
