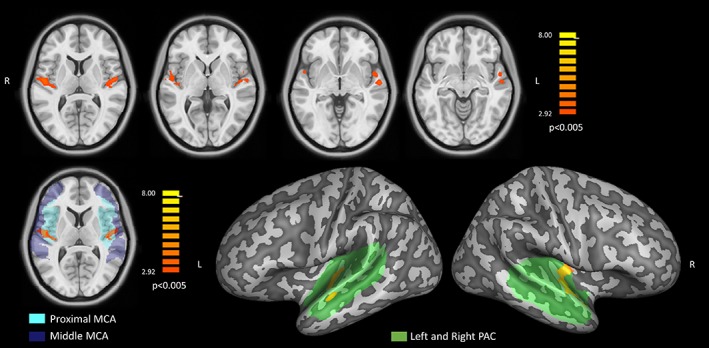
Figure 4.

Upper row: statistical t maps of the bilateral effects in the voxel‐based comparison between hearing loss (HL) and normal hearing (NH; p < 0.005). Bottom left: single slice view of the same statistical t map showing the bilateral effect with the proximal (cyan) and middle (blue) perfusion territories supplied by the middle cerebral arteries (MCAs) superimposed in transparency. Bottom right: projection of the same statistical t map, on the MNI surface meshes with the anatomical mask of the primary auditory cortex (PAC) superimposed in green transparency [Color figure can be viewed at http://wileyonlinelibrary.com]
