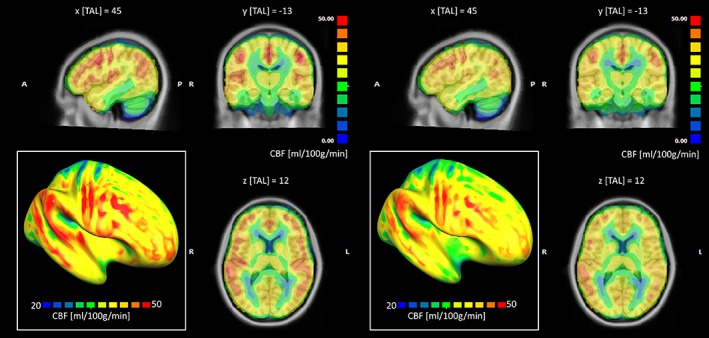
Figure 5.

Group‐averaged whole‐brain cerebral blood flow (CBF) maps calculated after correcting the absolute values for the global CBF, for the normal hearing (NH) group (left panel) and the hearing loss (HL) group (right panel) displayed on a triplanar volumetric view after scaling between 0 and 50 mL/100 g/min. In the left‐bottom inset of each panel, the same maps have been projected onto the surface mesh of the right hemisphere and rescaled between 20 and 50 mL/100 g/min [Color figure can be viewed at http://wileyonlinelibrary.com]
