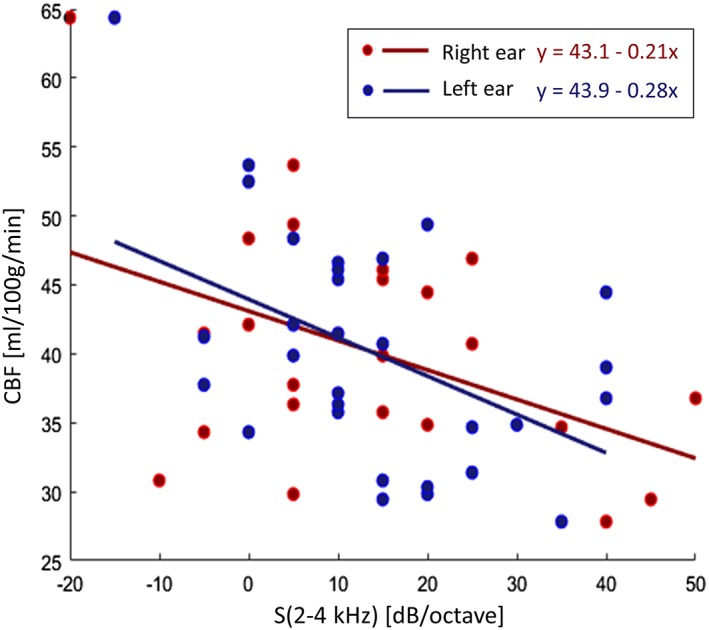
Figure 6.

Scatter plot and linear trends (and line equations) of the correlations between the audiogram steepness (2–4 kHz) and the cerebral blood flow mean value in the cluster of significant difference between normal hearing and hearing loss (HL) [Color figure can be viewed at http://wileyonlinelibrary.com]
