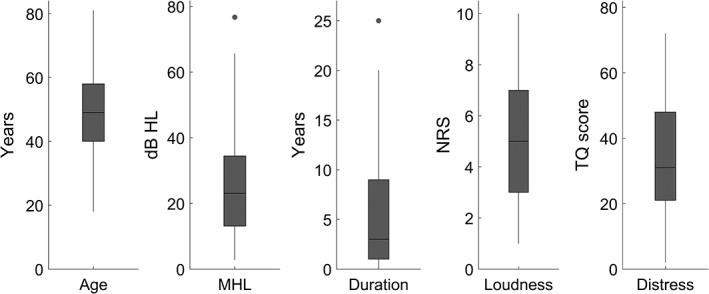
Figure 1.

Boxplots displaying the summary statistics for the tinnitus patient characteristics and behavioral data. From left to right, the boxplots display age, mean hearing loss (dB HL), the duration of tinnitus symptoms, tinnitus percept loudness (0–10 numeric rating scale), and tinnitus‐related distress (TQ score). The line in the center of each box indicates the mean, the outer lines of each box indicate the interquartile range, and the whiskers indicate the full range of the data excluding any outliers, which are indicated by dots
