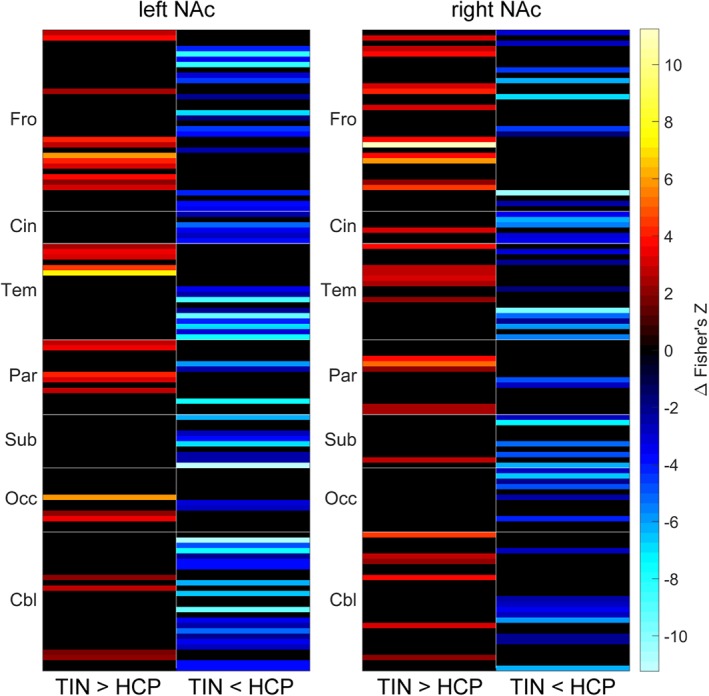
Figure 3.

Subtraction analysis (TIN > HCP, i.e., tinnitus > controls) of rsFC between left/right NAc and the rest of the brain parcellated using the AAL2 atlas. The analysis includes covariates for both age and whole‐brain overall rsFC. Results are presented as heatmaps that have been separated into columns displaying where rsFC is increased (left; warm colors) or decreased (right; cool colors) in tinnitus subjects relative to controls. Displayed results are significant at the 0.05 level, including the FDR correction for multiple comparisons; results that did not reach significance were manually set to zero (=black) [Color figure can be viewed at http://wileyonlinelibrary.com]
