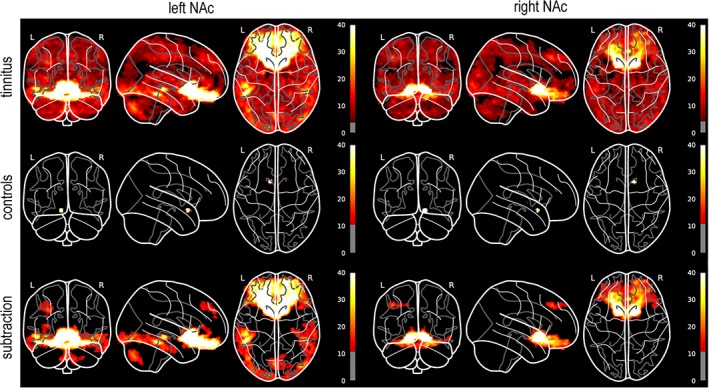
Figure 4.

Glass‐brain visualizations of voxelwise rsFC with left/right NAc seed regions. All analyses include age and whole‐brain rsFC as covariates. The within‐group results for the tinnitus and control subjects (top, middle) are presented at height thresholds of p < 0.05 and cluster thresholds of p < 0.05, both including the FDR correction for multiple comparisons. The subtraction analysis (bottom) is presented at a height threshold of p = 0.0001 (uncorrected) and a cluster threshold of 200 voxels. These height thresholds are reflected by the grayed‐out regions of each colorbar. The colorbar range over all subfigures has also been restricted to a maximum height of 40 (F‐statistic) both for the purposes of direct visual comparison and also to better display the overall variance in the data; the true maxima of the subfigures are much higher, owing to the high correlations of the seed regions with the voxels in and around them [Color figure can be viewed at http://wileyonlinelibrary.com]
