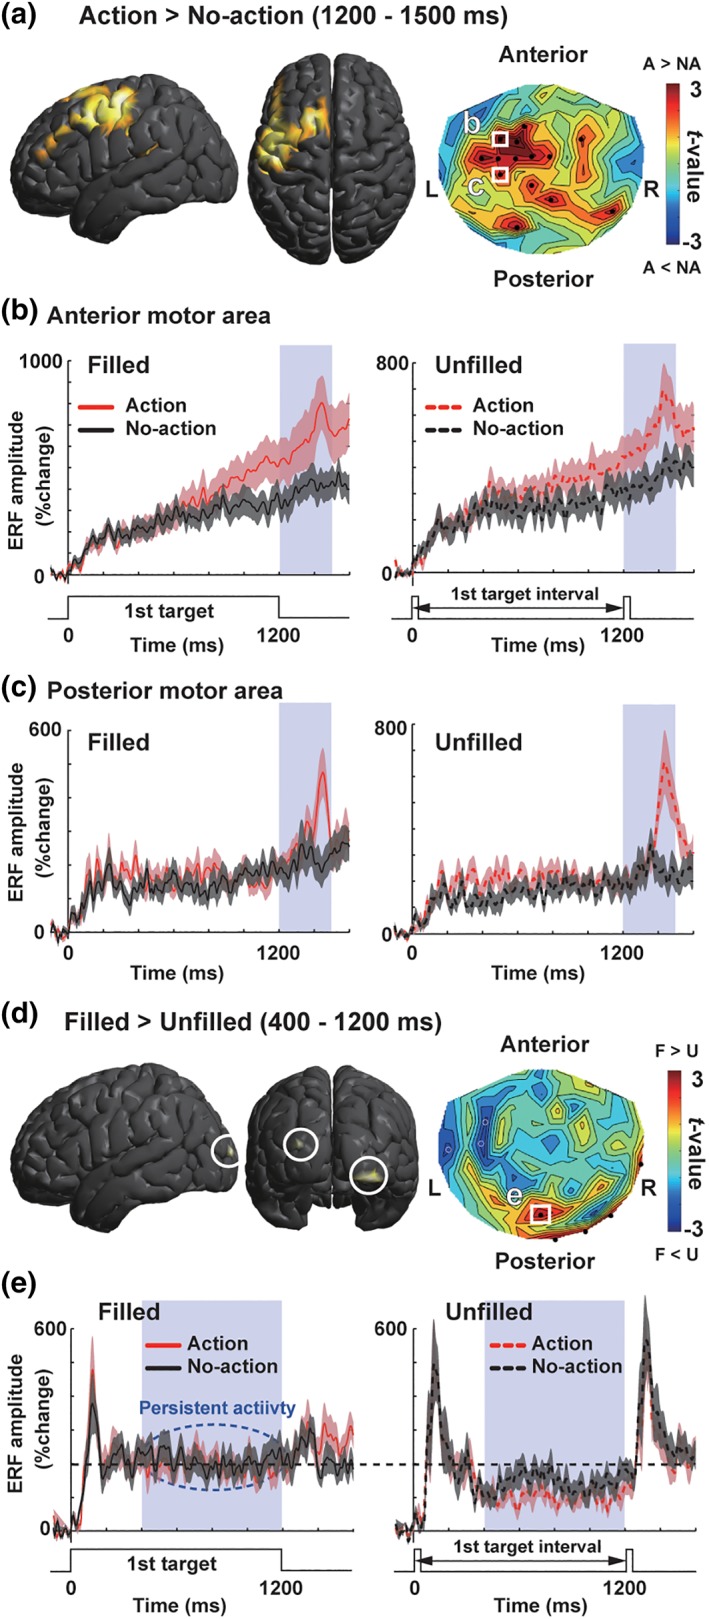
Figure 3.

Basic results of ERF analyses. (a) Neuromagnetic activity induced by the release and repress movements (motor factor) when the first target length was 1,200 ms (1,200 ms trials). Left and middle panels show lateral and top views of a source‐space t‐map (SPM 12) comparing action (A) and no‐action (NA) trials. In this and subsequent figures, thresholds of source‐space maps were lowered into p < .005 for visual purpose only. A right panel shows a sensor‐space t‐map. The t‐values comparing mean amplitudes of vector‐norm ERFs (1,200–1,500 ms) between action and no‐action trials were color‐coded on a contour map depicted over a two‐dimensional (2D) layout of 102 sensor positions. (b) Vector‐norm ERFs at a sensor over the anterior motor region (see a white square in a). Red and black lines denote action and no‐action trials (background shading: SE across 18 subjects). Build‐up increases of ERFs in a preaction (first‐target) period indicate that this region was related to both preparation and execution of manual movements. (c) Vector‐norm ERFs in the posterior motor region. Sharp increases of ERFs around 1,400 ms suggested that this region was related to the execution of manual movements. (d,e) Comparison of filled and unfilled conditions (visual factor). An onset of a white disk (first target) elicited strong MEG responses in all types of trials (0–400 ms). This was followed by a persistent activity stronger in filled than unfilled conditions (400–1,200 ms), which reflected a continuous presentation of the white disk [Color figure can be viewed at http://wileyonlinelibrary.com]
