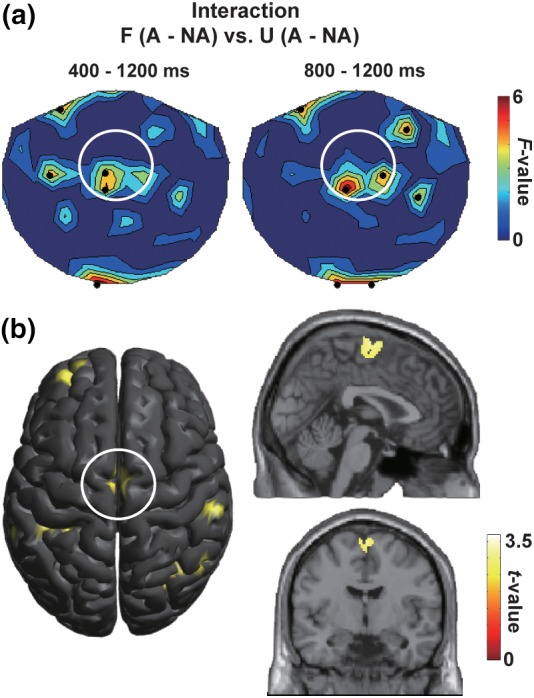
Figure 4.

Neural correlates of the action‐induced time dilation. (a) The F‐maps showing an interaction of visual (filled/unfilled) and motor (action/no‐action) factors (repeated‐measures anova) at 400–1,200 ms (left) and 800–1,200 ms (right). A difference between filled‐action (F‐A) and no‐action (F‐NA) trials was compared with a difference between unfilled‐action (U‐A) and no‐action (U‐NA) trials. Black dots indicate sensors showing a significant (p < .05) interaction. The F‐values at local maxima over the front‐midline region (white circle) were 5.19 (p = .036) in the left panel and 6.92 (p = .018) in the right panel. (b) Source locations of the medial frontal activity showing the interaction of visual and motor factors (estimated by SPM using a contrast of [F‐A, F‐NA, U‐A, U‐NA] = [1, −1, −1, 1]). Talairach coordinates of a local maximum was x = 1, y = −7, z = 65 (Brodmann area 6). This area (supplementary motor area or SMA) has been known as a core region for the processing of time information [Color figure can be viewed at http://wileyonlinelibrary.com]
