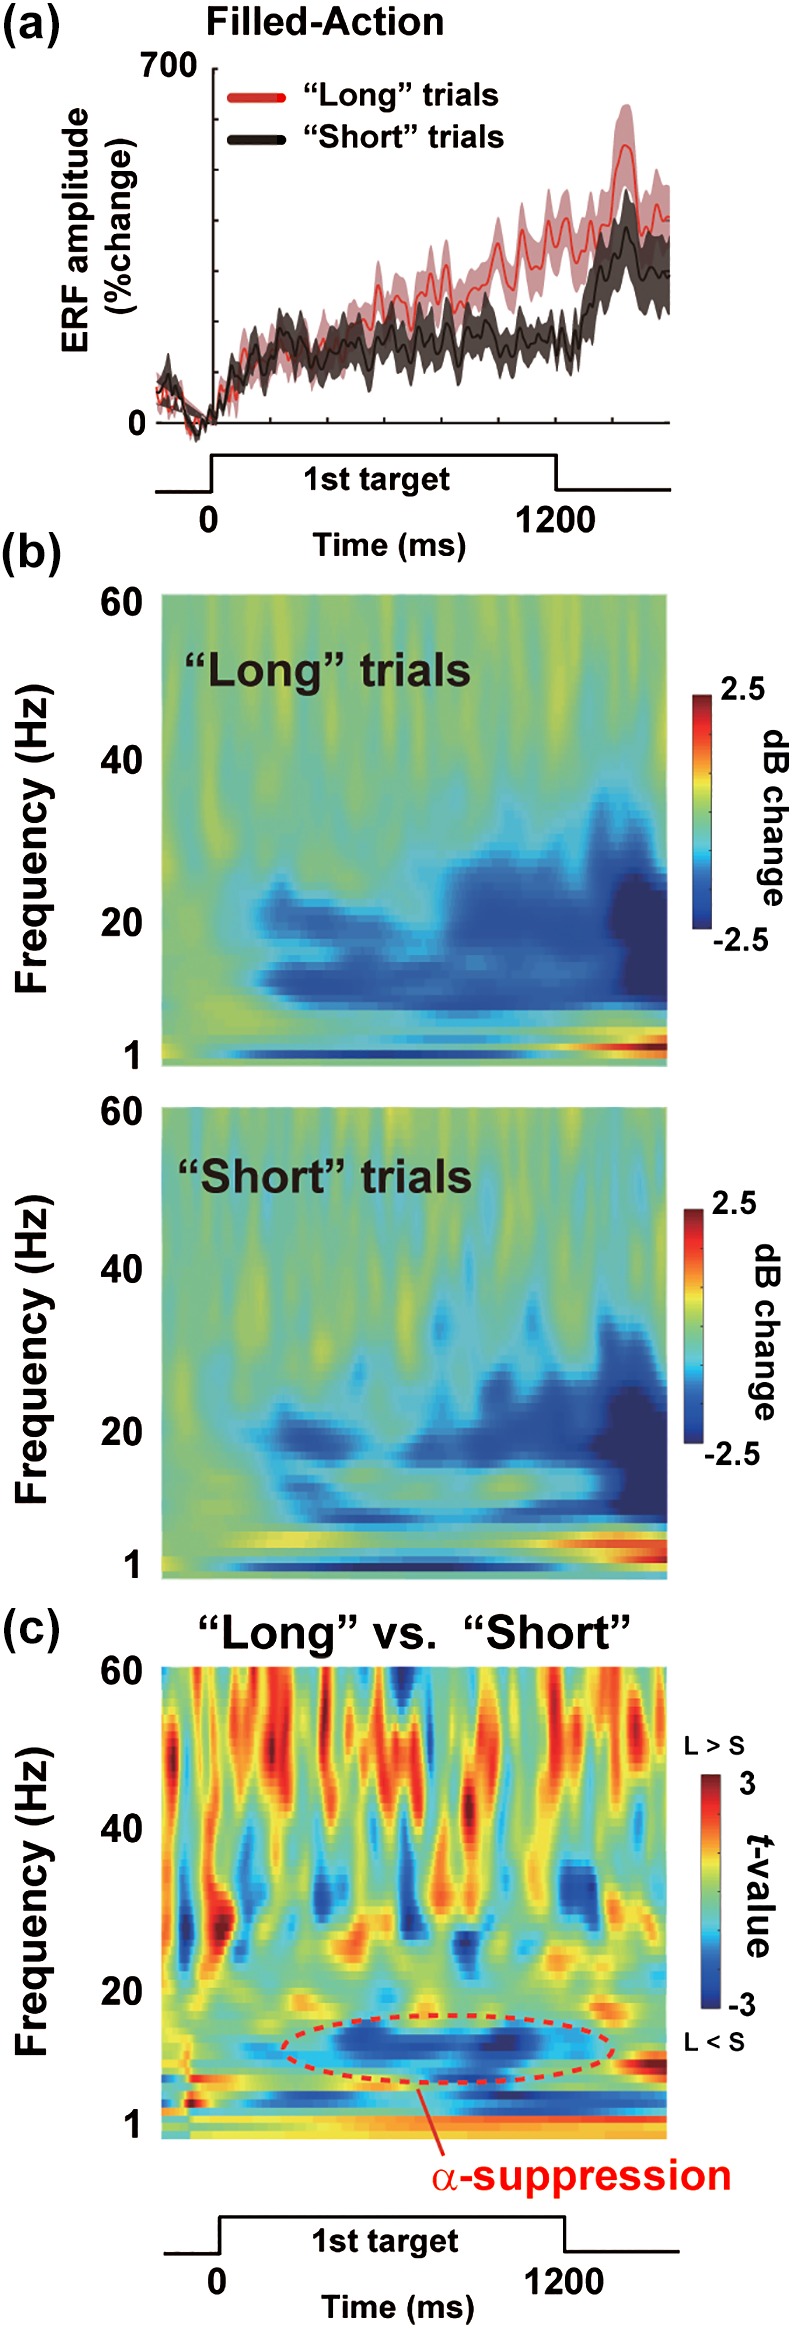
Figure 8.

Results of the response‐based analysis in F‐A trials. (a) Vector‐norm ERFs at the L5 in “long” trials (red) and “short” trials (black). (b) TF spectra in the “long” and “short” trials. (c) The color‐coded matrices of t‐values comparing oscillatory powers between “long” and “short” trials. Behavioral effects of time dilation were closely coupled with a decrease in alpha power [Color figure can be viewed at http://wileyonlinelibrary.com]
