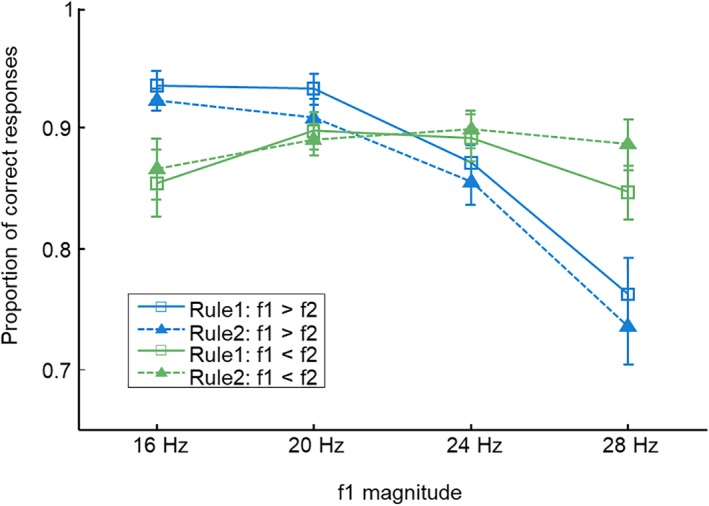
Figure 2.

The average behavioral performance across participants. The performance was modulated by the contraction bias (see text), irrespective of what rule was applied. Error bars represent the standard error of the mean [Color figure can be viewed at http://wileyonlinelibrary.com]
