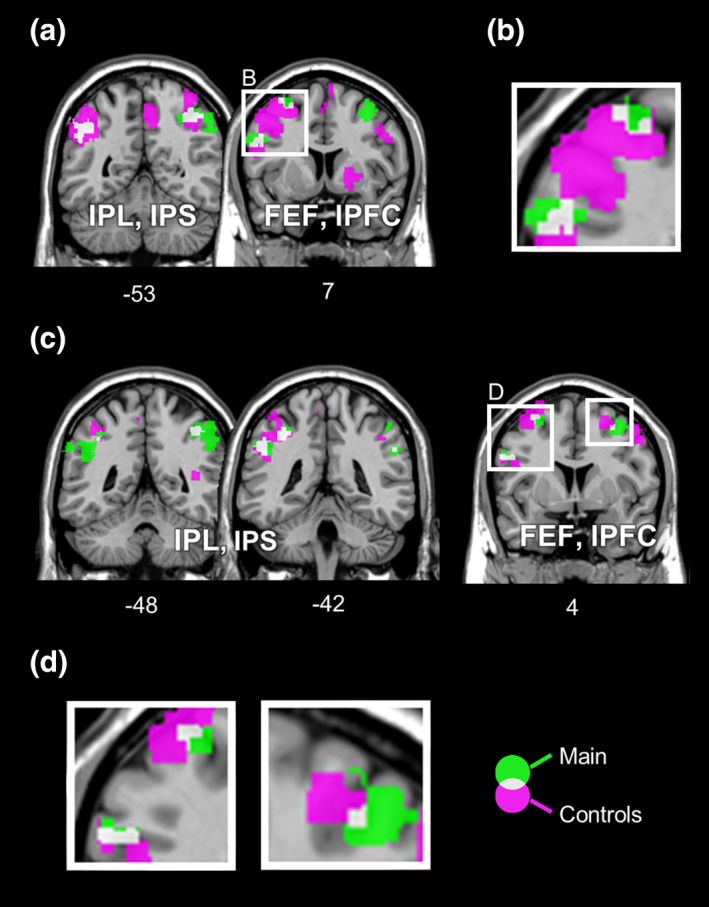
Figure 4.

Comparisons between choice‐selective regions identified in the main analysis with regions detected in the additional analyses controlled for effects related to the stimulus order (a, b) and the saccade selection (c, d). Results of the main analysis are displayed in green, while results from the control analyses are depicted in magenta. (a) Except the right FEF, all other clusters found in the main analysis (the bilateral intraparietal regions, the left lPFC, and the left FEF) overlap partially with those from the analysis controlled for the stimulus order. (b) Detail of the left prefrontal regions (cf. a) showing partial overlaps. (c) In addition to the overlapping regions shown in a, an overlap in the right FEF is also evident between the main analysis and the analysis controlled for saccade selection. (d) The left panel depicts the detail of overlaps in the left frontal regions, while a detailed view of the right FEF is displayed in the right panel (cf. c). Results are shown at a cluster corrected threshold of p FDR < 0.05 for the main analysis and at uncorrected voxel‐wise threshold of p < 0.001 for the control analyses. The unthresholded statistical maps are available at https://neurovault.org/collections/PTJKPIWY/ [Color figure can be viewed at http://wileyonlinelibrary.com]
