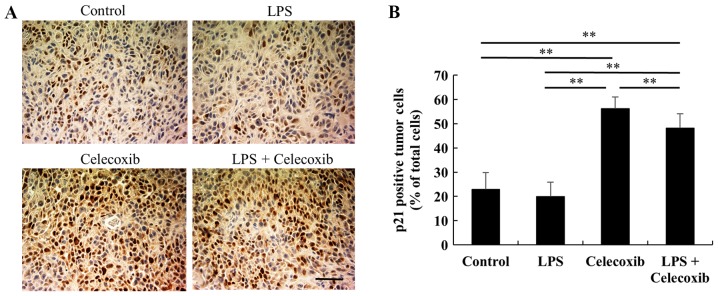
Figure 5.
Immunohistochemical assessment of p21 in HSC-3 ×enografts in response to celecoxib with/without LPS-treatment. (A) Representative microphotographs of p21-immunostained tumor sections in each group. Scale bar, 50 µm. (B) Percentage of p21-positive tumor cells. Each column represents the mean number of p21-positive cells ± standard deviation. The celecoxib-treated and LPS + celecoxib-treated groups had significantly increased levels of p21 compared with the control and LPS-treated groups. The levels of p21 in the LPS + celecoxib-treated group were significantly decreased compared with those in the celecoxib-treated group. **P<0.01 vs. control or LPS-treated group. LPS, lipopolysaccharide.

