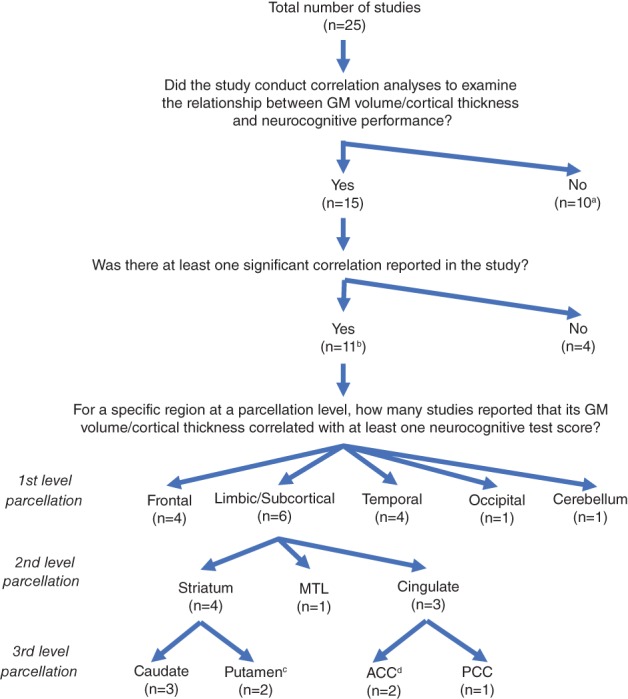
Figure 3.

The summary of correlation analyses between GM volume/thickness and neurocognitive performance. Note. aOne study (Pfefferbaum et al., 2014) that only examined the correlation with the trajectory of changes in neurocognitive performance was included in the list of studies that did not examine the correlations. bThe list of 11 studies included one study (Clark et al., 2015) that examined emotion recognition, and another study (Ragin et al., 2012) that correlated neurocognitive performance with total GM volume and total cortical GM volume. cThis includes a study (Castelo et al., 2007) that detected a negative correlation between right putamen volume and motor speed performance. dThe list included a study (Clark et al., 2015) that found a correlation between ACC volume and emotion recognition. ACC: anterior cingulate cortex; GM: gray matter; MTL: medial temporal lobe; PCC: posterior cingulate cortex [Color figure can be viewed at http://wileyonlinelibrary.com]
